Statistics: Confidence Intervals
Introduction
A confidence interval (CI) tells you how sure you can be that the value of a population being studied falls within a designated range of values, between an upper and lower bound. Often this degree of confidence is shown as a percentage within which a population average lies at the center of the range. For example, 95% confidence means that if you do 100 tests, you are confident the value will fall within that specified range 95% of the time, while 5% of the time it will not.
Functions
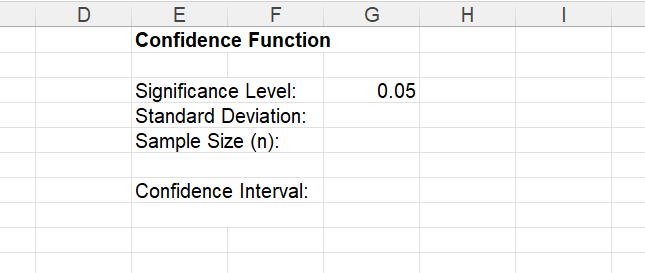
CONFIDENCE (alpha, sigma, n)
*Alpha (0.05) also goes by significance level or confidence level.
n stands for sample size or number of observations.
Sigma is standard deviation.
The CONFIDENCE function calculates a value that you can use to construct a confidence interval for the mean of a population. This formula requires the input of the alpha (the percentage of confidence that a number will fall within a certain range) which is typically 95% (sometimes studies use 99%). The alpha input must fall somewhere between 0 and 1. For example, based on a 95% confidence, 0.05 is used as the alpha value (subtract 95% as a decimal, 0.95, from 1). You also need to know the standard deviation of the data you are working with. The standard deviation value is inputted for sigma in the CONFIDENCE formula. Lastly, input the number of observations in the sample for n.
Rule of thumb using the CONFIDENCE Formula:
The most straightforward way to apply the CONFIDENCE formula is to add the confidence interval (0.05) onto the Excel sheet containing your data set.
Then in a separated cell, calculate the standard deviation of your data set.
Lastly, you can quickly calculate the number of observations you have using the COUNT formula.
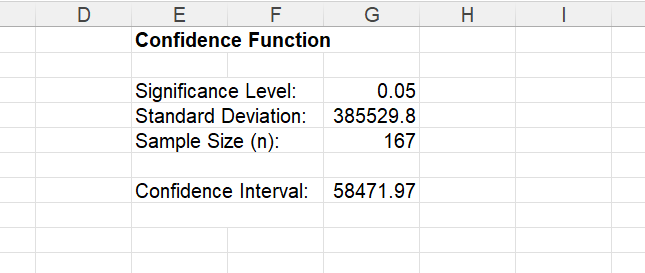
Input =CONFIDENCE and in parenthesis input the significance level, number of observations, and the standard deviation of the population.
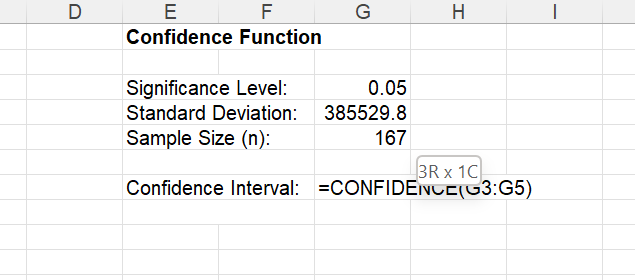
The Confidence Interval of the dataset applied should be revealed afterward.
Practice
Practice finding confidence intervals by answering the questions below in the highlighted cell.
- What is the confidence interval for Consumer Price Index data?
Answer
Confidence Interval: 93.80550757
Conclusion
Calculating confidence intervals is a necessary step in the data analysis process. This step allows for the analyst to determine to what extent the sample of a subset of the population reflects the characteristics of the larger population. It is important when reporting on findings to disclose the confidence interval to inform readers of the limitations on the data’s accuracy.