Basics: Filtering
Introduction
In Excel, users are able to filter data in a range or data table to show data that meets a certain requirement or criteria and hide the rest that does not meet the requested criteria.
Uses
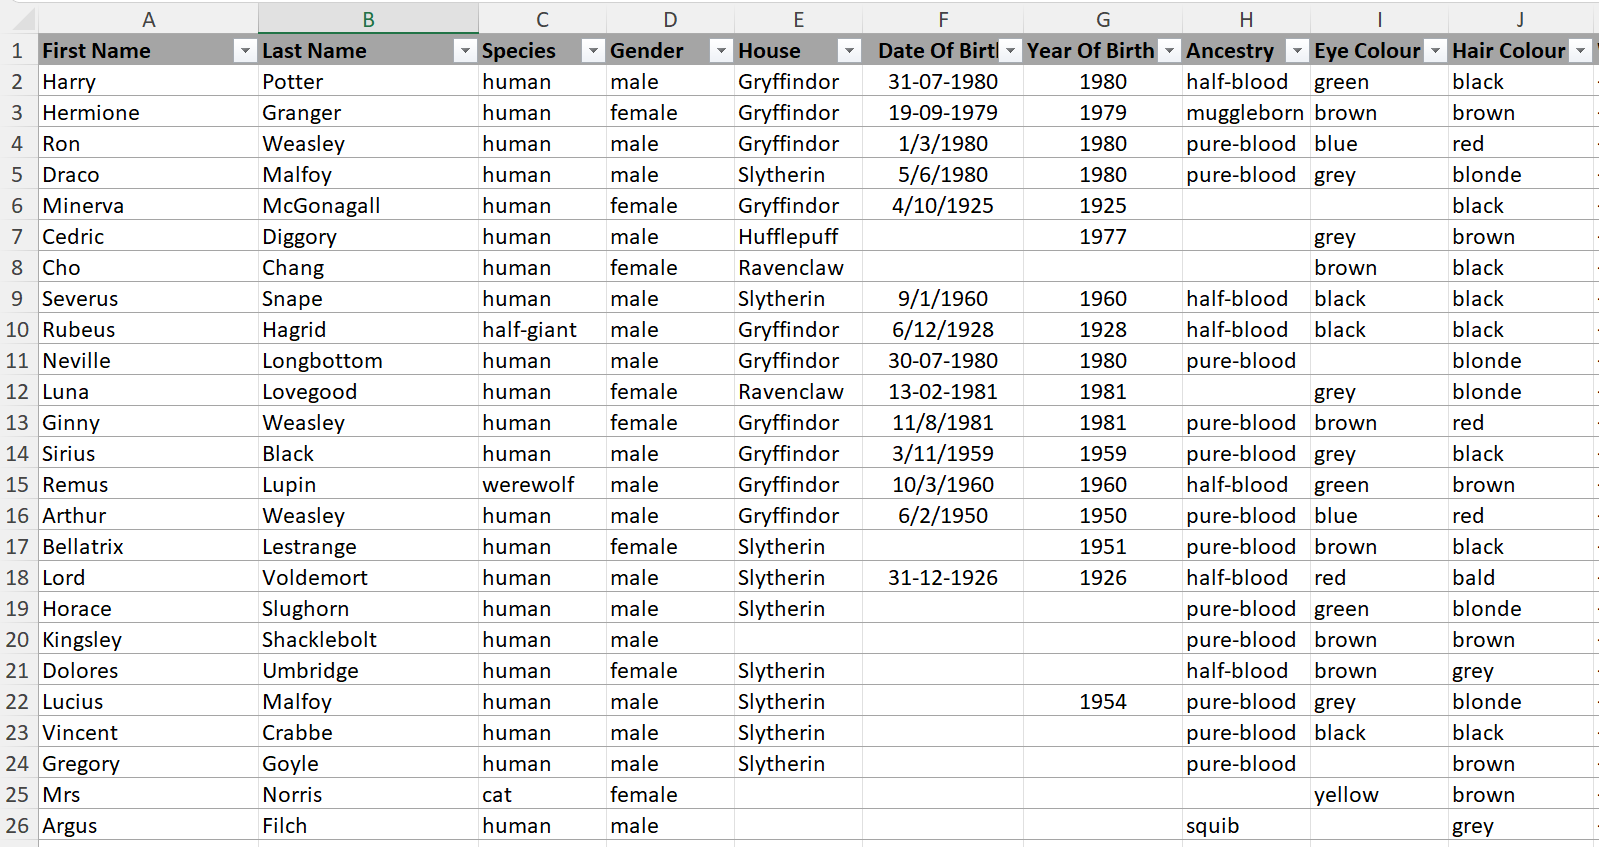
Filtering information in a worksheet allows you to find values quickly. When users apply a filter (e.g. language) to a single column of data, any data that does not meet the criteria (e.g. people who speak Urdu) set by the filter will be hidden (e.g. all people who do not speak Urdu). A single filter can be applied to one column of data in a table or a range of cells. Users can also set multiple filters with multiple criteria to further narrow results (e.g. people who speak Urdu and live in California). Within a single criteria (e.g. language), it is also possible to select multiple requirements (e.g. people who speak Urdu and people who speak Punjab). The table we are using to demo this exercise is provided on the right.
How-to find the Filter Function
Example for Filtering Information
Practice
Practice filtering by downloading the world bank dataset and answering the question below. Answers to this lesson can be found TBD
Using the column “Birth rate, crude (per 1,000 people)” filter for all values less than 20
Conclusion
Using filtering is an essential tool in your Excel toolbox and is especially useful when dealing with large datasets. Filtering enables you to hide certain rows of data in order to focus on what you are specifically looking for.